Unilever Aktie
WKN: A41NM1
ISIN: GB00BVZK7T90
Land: Großbritannien
Branche: Handel, Konsum & Ernährung
Sektor: Konsumgüter
57,12 EUR
Geld 57,04  Brief 57,09
1,32  EUR
Zeit 18:03:02 · Börse Stuttgart
2,37  %
Datum 14.10.26
boerse.de-
Aktien-
Rating:

(Info)
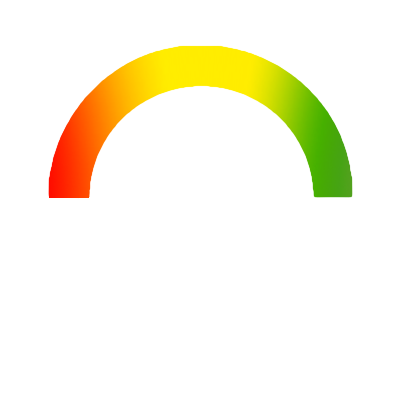
B

Weshalb die Unilever-Aktie
ein B-Rating hat,
erfahren Sie im Performance-Check
vom 14. Oktober 2026 Info.

Komplette Navigation anzeigen

Statistik Unilever seit 25.05.1998

Unilever Aktie: Die besten Tage

Rang Datum Eröffnung Schluss Performance
1 28.10.1998 16,92 20,31 20,04%
2 12.01.1999 20,19 23,17 14,76%
3 22.12.1999 15,13 17,02 12,49%
4 20.10.2008 18,17 20,40 12,27%
5 31.10.2002 21,75 24,23 11,40%
6 23.05.2000 16,79 18,68 11,26%
7 07.05.2009 15,83 17,54 10,80%
8 08.08.2000 15,37 17,02 10,74%
9 02.05.2001 18,20 20,10 10,44%
10 17.02.2017 42,64 47,04 10,32%
11 05.04.2000 16,08 17,73 10,26%
12 14.10.2008 17,57 19,30 9,85%
13 31.03.2000 14,66 16,08 9,69%
14 23.07.2020 51,22 55,72 8,79%
15 18.02.2000 13,48 14,66 8,75%
16 02.11.2001 18,32 19,86 8,41%
17 16.03.2000 14,19 15,37 8,32%
18 13.05.2009 17,18 18,60 8,27%
19 28.07.2026 54,09 58,56 8,26%
20 17.03.2020 44,23 47,88 8,25%

Unilever Aktie: Die schlechtesten Tage

Rang Datum Eröffnung Schluss Performance
1 07.02.2000 15,60 13,24 -15,13%
2 17.08.1998 23,33 20,31 -12,94%
3 28.01.2000 17,73 15,60 -12,01%
4 09.11.1999 20,57 18,20 -11,52%
5 24.06.2003 18,54 16,74 -9,71%
6 20.09.2001 21,87 19,86 -9,19%
7 23.03.2020 50,04 45,59 -8,89%
8 02.10.1998 17,89 16,32 -8,78%
9 18.09.1998 18,74 17,17 -8,38%
10 02.05.2003 21,28 19,50 -8,36%
11 17.12.2019 60,30 55,29 -8,31%
12 08.10.2008 21,52 19,74 -8,27%
13 09.03.2020 54,23 49,86 -8,06%
14 27.03.2000 15,84 14,66 -7,45%
15 12.03.2020 51,44 47,62 -7,43%
16 16.10.2008 19,30 17,88 -7,36%
17 19.10.2000 19,39 17,97 -7,32%
18 29.01.1999 22,70 21,04 -7,31%
19 15.12.1999 16,31 15,13 -7,23%
20 06.12.2000 22,93 21,28 -7,20%