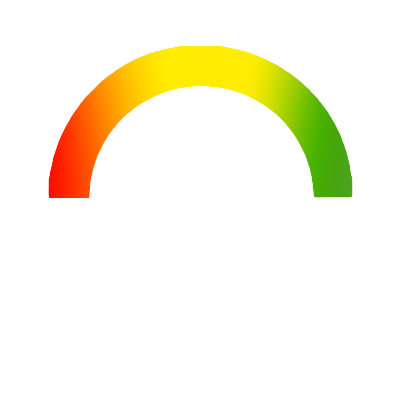






Weshalb die Alamos Gold-Aktie
ein A-Rating hat,
erfahren Sie im Performance-Check
vom 17. August 2026 Info.
| Zeithorizont |
Performance Volatilität |
Hoch Tief |
am | Abstand |
|---|---|---|---|---|
| 1 Woche | -0,53% 5,65% |
29,63 28,27 |
12.08.26 14.08.26 |
-4,59% 0,00% |
| 2 Wochen | 15,48% 10,04% |
29,63 24,14 |
12.08.26 03.08.26 |
-4,59% 17,11% |
| 1 Monat | 10,30% 14,33% |
29,63 24,14 |
12.08.26 03.08.26 |
-4,59% 17,11% |
| 3 Monate | -23,41% 33,43% |
36,91 24,14 |
14.05.26 03.08.26 |
-23,41% 17,11% |
| 6 Monate | -25,90% 44,49% |
47,33 24,14 |
02.03.26 03.08.26 |
-40,27% 17,11% |
| 1 Jahr | 30,22% 59,58% |
47,33 21,71 |
02.03.26 14.08.25 |
-40,27% 30,22% |
| 3 Jahre | 163,71% 77,94% |
47,33 10,24 |
02.03.26 21.08.23 |
-40,27% 176,07% |
| 5 Jahre | 344,50% 96,18% |
47,33 5,70 |
02.03.26 04.02.22 |
-40,27% 395,96% |
| 10 Jahre | 254,71% 149,10% |
47,33 2,65 |
02.03.26 17.12.18 |
-40,27% 966,79% |